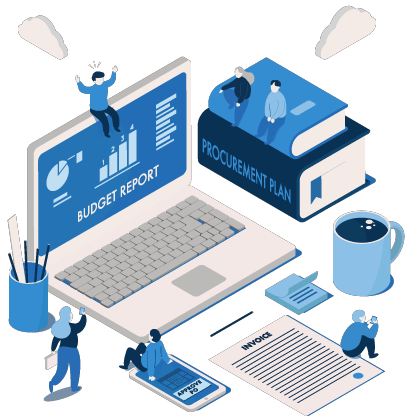

For effective financial planning, small businesses and large corporations alike rely on balance sheet forecasting (sometimes called financial modeling). Estimating your future revenue and expenses provides useful insights for financial planning and helps insulate your business against potential disruptions, as well as factors such as seasonality.
One of the most important balance sheet items is accounts payable (AP). Representing your short-term liabilities (usually paid off within a year or less), accounts payable need to be accurately forecast in order to ensure not only the accuracy of your financial statements, but a clear picture of the amount of cash you have available for growth and innovation as well as paying your debts.
Accounts Payable Forecasting: The Basics
One of many balance sheet line items, accounts payable requires special attention because, like its complement accounts receivable (AR), it has a direct impact on a company’s cash flow.
Accounts receivable represent revenue owed to your company by customers, whereas accounts payable includes your short-term liabilities (also called current liabilities), including bills for goods and services, that are usually due in 90 days or less, but are paid within a year or less at the outside.
Accounts payable and accounts receivable balance sheet line items each appear under one of the “big three” categories appearing on most balance sheets: Assets, Liabilities, and Equity.
Assets
- Accounts Receivable
- Capital Expenditures (Property, Plant, and Equipment (PP&E))
- Inventory
- Additional Current Assets
- Additional Long-Term Assets
Liabilities
- Accounts Payable
- Long-Term Debts (including interest expenses)
Equity
- Shareholder Equity
- Retained Earnings
A balance sheet forecast is itself part of a larger financial modeling approach known as the three-statement financial modeling, which combines a company’s income statement, cash flow statement, and balance sheet to create a comprehensive financial outlook.
Note: Prior to creating a balance sheet forecast, you’ll need a projected income statement that’s been completed up to interest expenses and depreciation expenses. The income statement will be finished as you complete the balance sheet.
Along with accounts receivable and inventory, accounts payable has the most direct impact on both transparency into current working capital, but also estimating future cash balances (i.e., cash flow forecasting).
Forecasting accounts payable on the balance sheet helps you fine-tune your payment patterns as necessary to maintain a healthy working capital ratio while preserving your vendor relationships and capturing important incentives such as early payment discounts when desired. The greater the accuracy of your AP forecast, the more power you’ll have to make strategic adjustments in your financial modeling.
“One of many balance sheet line items, accounts payable requires special attention because, like its complement accounts receivable (AR), it has a direct impact on a company’s cash flow.”
How to Forecast Accounts Payable on the Balance Sheet
Like inventory and accounts receivable, accounts payable balance sheet entries are directly connected to operations and your cash cycle. Accordingly, they can be calculated based on days outstanding, or the average number of days required to get paid (accounts receivable), sell finished goods currently on hand (inventory), or pay your short-term liabilities (accounts payable).
For accounts payable, this formula is called days payable outstanding, or DPO. It is the complement to days sales outstanding (DSO), used for accounts receivable.
DPO uses another important value, known as cost of goods sold (COGS), sometimes called cost of sales. This figure represents the actual costs associated with producing the goods your company sells, including labor and materials.
If you have historical data available, it’s easy enough to calculate DPO with a simple formula, like so:
Average Accounts Payable ÷ Cost of Goods Sold (or Purchases) x 365 = Accounts Payable Days (DPO)
Note: The 365 in this formula assumes an accounting period of one year, but if you’re calculating for a different accounting period, you can replace it with the number of days in that period, e.g. 30, 60, 90, etc.
Alternatively, you can use this formula:
Average Accounts Payable ÷ (Cost of Sales ÷ Number of Days in Accounting Period) = DPO
Note: For this formula:
Cost of Sales = Beginning Inventory + Purchases – Ending Inventory
and
Purchases = Ending Inventory – Beginning Inventory + COGS
Record your forecasted AP values in the appropriate period under Liabilities on the balance sheet.
The more data you have, the more accurate your future accounts payable forecasts will be, as you’ll be able to identify trends that will allow you to predict next year’s AP for a given period based on previous accounting periods (months, quarters, years, etc.).
An additional benefit of this calculation method, however, is that those same trends can provide insight into areas where you can improve your cash flow and maintain your desired cash balance by optimizing AP.
Streamline Your AP Forecasting with Analytics, Automation, and AI
It’s definitely possible to manage all your financial modeling using manual workflows or even customized Excel spreadsheets. But you’re sacrificing not only speed and accuracy, but transparency and strategic insights by doing so.
Choosing to automate all your accounts payable processes with a comprehensive, cloud-based software solution like PurchaseControl gives you total control over, and on-demand, transparent access to, all your spend data. Coupled with advanced analytics, customizable financial reporting tools, and process automation, this gives you a much easier way to track, calculate, and fine-tune all your financial workflows for peak performance, accuracy, and completeness.
- A full procure-to-pay (P2P) suite means every purchase is automatically captured inside a closed buying environment, eliminating rogue spend and invoice fraud that can skew available working capital data and impair cash flow forecasting.
- Financial modeling is much easier with on-demand reporting. Users with appropriate access can analyze historical data to create current financial statements, cash flow analysis, and custom forecasts from an easy-to-use control panel, drawing on all available sources and documents from a single, centralized data management system.
- Integration with popular office applications (including Microsoft Excel) ensures current data is available both from and inside legacy systems.
- Process automation and continuous improvement help you optimize workflows, reduce cycle times, and make smart, strategic decisions.
- Insights from data analysis let you balance your company’s cash flow while maintaining good vendor relationships and still allowing for the capture of early payment discounts where appropriate.
Proper Accounts Payable Forecasting Helps Your Business Thrive
It’s just one part of your complete balance sheet forecast, but accounts payable plays a major role in your company’s financial planning and performance. Invest in technology to streamline the process and make sure you’re calculating accounts payable forecasts correctly and completely, and you’ll be able to build a better financial future for your business.
Create Accurate Forecasts Supported by AP Automation and Total Data Transparency with PurchaseControl
Find Out How